Next: 4b: Practical debugging part II - Objects and Handles
4a: Practical debugging part I - Processes
This will once again be a practical Windbg and Windows Kernel “workshop”. The difference to part 2 is that I won’t explain all the commands and I will assume that you have a reasonably good idea what is going on. If not: go over the previous parts again, search the internet for some additional information or useful diagrams, write me an email.. please don’t blindly copy & paste my commands to Windbg.
Detour
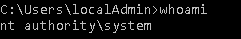
Before we go back to Windbg let’s do a quick (and completely optional) detour: the Process Explorer from the sysinternals toolkit to you debugee and download and install ‘Cheatengine’ (or any other program that acquires a process handle) also on you debugee. Next launch cheatengine and open another process (File -> Open Process), it doesn’t matter which one. Then open the process explorer (Open as administrator or escalate permission using File -> “Show details on all processes”) and find the Cheatengine executable. Next go to the menu under “View” -> “Lower Pane View” and select “Handles”. This opens a windows with all handles owned by this process, a pretty important little gem inside the already useful process explorer. If you scroll down the list of handles you should find a process handle to whatever process you opened in Cheatengine. That’s because Cheatengine went to Mr. Windows and got itself a handle on the process object. Now it can use this handle to access the process memory and cheat in games.
If you double click on the handle it will even show you a memory address, presumably of the object the handle points at. This is skipping ahead a bit, but a process object is represented by an “nt!_EPROCESS” data structure. So what do we do?
What do we do?
We switch to Windbdg on our debugging machine, break execution and try: dt nt!_EPROCESS <address>. If we search through the output we should find an ImageFileName that tells us that we are indeed viewing the EPROCESS structure of whatever process we opened in Cheatengine.
This it should look like:
The rest of this chapter will focus on processes, but we will pick up the handles in the next chapter part4_handles.
Processes
The Windbg extension command to view process information is !process((Don’t confuse it with .process, which switches Windbg into the context of a specific process.)). Try out at least !process 0 0 to view basic information on all running processes and !process 0 7 onedrive.exe to view detailed information on a specific process. Try out the ‘links’ to additional commands Windbg creates inside the output. You can use those for further exploration. Reading the command syntax of these links can also be a useful source if information on how to do things yourself.
But that isn’t what I am aiming at right now. We don’t want to know what processes are running we want to know what and how the windows kernel knows about them. And the Windbg extension commands aren’t telling us anything about that.
What we can do is use x nt!PsActiveProcessHead to get a pointer to the head of the double linked list in which the windows kernel stores all running processes. So what does it point at?
What does nt!PsActiveProcessHead point at?
A LIST_ENTRY structure. Or more specifically a pointer to a LIST_ENTRY structure, try:
	kd> x nt!PsActiveProcessHead
	<address> nt!PsActiveProcessHead = <no type information>

	kd> dt nt!_LIST_ENTRY poi(<address>)
	   +0x000 Flink            : ... _LIST_ENTRY [... ]
	   +0x008 Blink            : ... _LIST_ENTRY [ ... ]
You can use the links provided by Windbg to jump around the forward and backward links. But be careful with all this: after forgetting the “poi” Windbg also gave me valid Flinks and Blinks I could use to go through a list. But I have no idea what that list would be or how that makes any sense.
Process list I
Windows uses the EPROCESS datastructure to store a process object, if you followed my detour at the beginning of the chapter you saw it already. The E stand for executive: but don’t think executive kernel, think executive object. So there is also a KPROCESS structure, containing the corresponding kernel object.
	kd> dt nt!_EPROCESS
	   +0x000 Pcb              : _KPROCESS
	   +0x2d8 ProcessLock      : _EX_PUSH_LOCK
	   +0x2e0 UniqueProcessId  : Ptr64 Void
	   +0x2e8 ActiveProcessLinks : _LIST_ENTRY
	   ..
The structure is rather big, but for now we are only interested in the first entries. The very first one is actually the KPROCESS structure so you can use the same address to access both structures. And at offset +0x2e8 the structure contains a LIST_ENTRY datastrucure of ActiveProcessLinks. Does that ring any bells? Sidenote: as always youverify all that yourself especially with structures like this where there is no guarantee that they will stay the same between Windows versions or Windows 10 releases.
Armed with that knowledge it should be easy to get the first EPROCESS structure in the Windows active process list:
How to find the the first EPROCESS stucture
	kd> r $t0 = nt!PsActiveProcessHead
	kd> dt nt!_EPROCESS  (poi(@$t0) - 0x2e8)
	..
	+0x450 ImageFileName    : [15]  "System"
	..

	// or let the Windbg c++ parser calculate the offset
	kd> dt nt!_EPROCESS  (poi(@$t0) - @@(#FIELD_OFFSET(nt!_EPROCESS, ActiveProcessLinks))
	...
	...
	// Windbg Master Class:
	dt nt!_EPROCESS ImageFileName (poi(nt!PsActiveProcessHead)-@@(#FIELD_OFFSET(nt!_EPROCESS,ActiveProcessLinks)))
	   +0x450 ImageFileName : [15]  "System"
Process list II
If you want to get information for all running processes you just have to follow the links through the list. Since it is circular you will eventually reach the first process again. Alternatively Windbg offers several commands to make that task much simpler. One of them is !list, another one it the -l parameter to dt
	// !list
	r $t1 = (poi(nt!PsActiveProcessHead)-@@(#FIELD_OFFSET(nt!_EPROCESS,ActiveProcessLinks)))
	!list -t nt!_EPROCESS.ActiveProcessLinks.Flink -x "dt nt!_EPROCESS ImageFileName" @$t1

	// dt .. -l
	dt nt!_EPROCESS @$t1 -l ActiveProcessLinks.Flink -y ImageFileName
if you read the documentation on these commands you will find additional options you can use to get more information out of them. But if you really need custom information out of lists ( forensics in kernel crash dumps would be an obvious use case) i would suggest you try to learn Windbg scripting. It’s not all that complicated and you will get more information with less effort.
Finding the process list
Yes, I know: we already found it. But what if we can’t use x nt!PsActiveProcessHead? For example because we want to write the driver component of some antivirus software: we have access to the kernel but not to Windbg extension commands. We have to find something else we can obtain that points at an EPROCESS structure. Or find something that points at something that points at an EPROCESS structure. Unfortunately am searching for a good way to do that. There are a few tools out there that can parse Microsoft symbol files, but nothing really great for this use case.
For now let’s just try a way other people have found (a long time ago actually): The windows kernel holds a structure called KPCR, the Kernel(?) Processor Control Register. It contains information on what is currently running on a certain logical processor. And it can easily be found from inside the kernel via an MSR register. ‘Model Specific Registers’ where invented by intel in the days of the 386 processor to add “feature” registers to the boring x86 standard. Since they are only accessible by the operating system they are useful to store certain system variables. Like the address to the KPCR structure. In Windbg we can read them with the rdmsr command:
	kd> rdmsr  0xC0000101
	-> <address>
	kd> dt nt!_KPCR  <address>
	...
Note: The KPCR pointer is also in the gs:18 segment register and in the nt!KiInitialPCR symbol.
	x nt!KiInitialPCR
	dps gs:18 l1
The KPCR structure is relatively well documented and stable across windows version. Much of the actual data is inside the KPCRB, the (Kernel) Processor Control Block which isn’t well documented or stable across windows version. But it’s still inside the kernel symbol file and that’s enough for us. The KPCRB contains a link to the KTHREAD structure of the thread currently running on the processor. And the KTHREAD structure in turn contains a link to a KPROCESS structure. And as we already know, the address if the KRPOCESS structure is also the address to an EPROCESS structure. And once we found an EPROCESS strucure we can access the linked list and can access all other EPROCESS structures as well.
	kd> dt nt!_KPCR <KPCR address>
	..
	+0x180 Prcb             : _KPRCB
	...
	kd> dt nt!_KPRCB <KPRCB Address>
	...
	+0x008 CurrentThread    : <KTHREAD Address> _KTHREAD
	...
	kd> dt nt!_KTHREAD <KTHREAD Address>
	...
	+0x220 Process          : <KPROCESS Address> _KPROCESS
	...
	kd> dt nt!_EPROCESS ImageFileName <KPROCESS Address>
	+0x450 ImageFileName : [15]  ...
If you get a valid ImageFileName it worked. We are still using Windbg commands but we now that we got all the offsets we could also do this in driver code. And of course it could simply stop working after the next windows update.
It also isn’t the only way to get to a EPROCESS structure. If you search around the web you will find others and there are probably more hidden in undocumented kernel code.
Exercise 1: Hiding a process
Let’s have some fun! Since the processor executes threads and the task manager displays processes.. we can hide a running program from the task manager (and the process explorer) without affecting it otherwise. It’s called “Direct Kernel Object Manipulation” and a classic rootkit technique. It works by editing the Process List in a way that a certain process cannot be accessed any more. In addition the list entries of the hidden entry have to point to itself, otherwise the system will crash.
What?
-
Part 1 is textbook “remove item from linked list”: point the flink of the previous process to the flink of the target process and the blink of the next process to the target process blink.
-
Then point target process flink and blink to the address of the target process flink
-
Use
dt nt!_LiST_ENTRYto verify what you are doing -
Run
!process 0 0to check if it works
More info please!
You should really do this on you own, but if you got stuck, this is a copy and paste of my test run:
	kd> !process 0 0 DbgView.exe
	PROCESS ffffa58e9ba65080
	    SessionId: 1  Cid: 0d28    Peb: 00263000  ParentCid: 0e18
	    DirBase: 5b8ad000  ObjectTable: ffffb7869fe4b040  HandleCount: 209.
	    Image: Dbgview.exe

	dt nt!_EPROCESS ActiveProcessLinks ffffa58e9ba65080
	   +0x2e8 ActiveProcessLinks : _LIST_ENTRY [ 0xffffa58e9befb8a8 - 0xffffa58e9bf088a8
	kd> dt nt!_LIST_ENTRY ffffa58e9ba65080+0x2e8
	 [ 0xffffa58e9befb8a8 - 0xffffa58e9bf088a8 ]
	   +0x000 Flink            : 0xffffa58e9befb8a8 _LIST_ENTRY [ 0xffffa58e9bf81368 - 0xffffa58e9ba65368 ]
	   +0x008 Blink            : 0xffffa58e9bf088a8 _LIST_ENTRY [ 0xffffa58e9ba65368 - 0xffffa58e9c1778a8 ]
	process after:
	kd> dt nt!_LIST_ENTRY 0xffffa58e9befb8a8
	 [ 0xffffa58e9bf81368 - 0xffffa58e9ba65368 ]
	   +0x000 Flink            : 0xffffa58e9bf81368 _LIST_ENTRY [ 0xfffff802c8be8ae0 - 0xffffa58e9befb8a8 ]
	   +0x008 Blink            : 0xffffa58e9ba65368 _LIST_ENTRY [ 0xffffa58e9befb8a8 - 0xffffa58e9bf088a8 ]
	kd> dp 0xffffa58e9befb8a8
	ffffa58e9befb8a8  ffffa58e9bf81368 ffffa58e9ba65368
	ffffa58e9befb8b8  0000000000000000 144d0c010000d000
	ffffa58e9befb8c8  01d3cdec6a5c0a98 0000000000031830
	ffffa58e9befb8d8  0000000000019ca8 0000000000031960
	ffffa58e9befb8e8  000000000001a060 0000020007656000
	ffffa58e9befb8f8  0000020005e7a000 ffffa58e9bf813c0
	ffffa58e9befb908  ffffa58e9c1d93c0 ffffa58e9a2b0310
	ffffa58e9befb918  ffffb7869ffe9062 0000000000000000
	process before:
	kd> dt nt!_LIST_ENTRY 0xffffa58e9bf088a8
	 [ 0xffffa58e9ba65368 - 0xffffa58e9c1778a8 ]
	   +0x000 Flink            : 0xffffa58e9ba65368 _LIST_ENTRY [ 0xffffa58e9befb8a8 - 0xffffa58e9bf088a8 ]
	   +0x008 Blink            : 0xffffa58e9c1778a8 _LIST_ENTRY [ 0xffffa58e9bf088a8 - 0xffffa58e9bf74368 ]
	kd> dp 0xffffa58e9bf088a8
	ffffa58e9bf088a8  ffffa58e9ba65368 ffffa58e9c1778a8
	ffffa58e9bf088b8  0000000000000000 144d0c010000d000
	ffffa58e9bf088c8  01d3cdec65b49c8a 0000000000004698
	ffffa58e9bf088d8  000000000003baf8 0000000000004720
	ffffa58e9bf088e8  000000000003f7e8 000000000cf37000
	ffffa58e9bf088f8  000000000caeb000 ffffa58e9ba653c0
	ffffa58e9bf08908  ffffa58e9c177900 ffffa58e9a920ad0
	ffffa58e9bf08918  ffffb7869f212063 0000000000000000

	Set process flink and blink to itself:
	kd> ep ffffa58e9ba65368 ffffa58e9ba65368
	kd> ep ffffa58e9ba65370 ffffa58e9ba65368

	Previous flink to flink and next blink to blink
	kd> ep ffffa58e9bf088a8 0xffffa58e9befb8a8
	kd> ? ffffa58e9befb8a8 + 8
	Evaluate expression: -99443056592720 = ffffa58e9befb8b0
	kd> ep ffffa58e9befb8b0 0xffffa58e9bf088a8

	kd> !process 0 0 DbgView.exe
	-> nothing
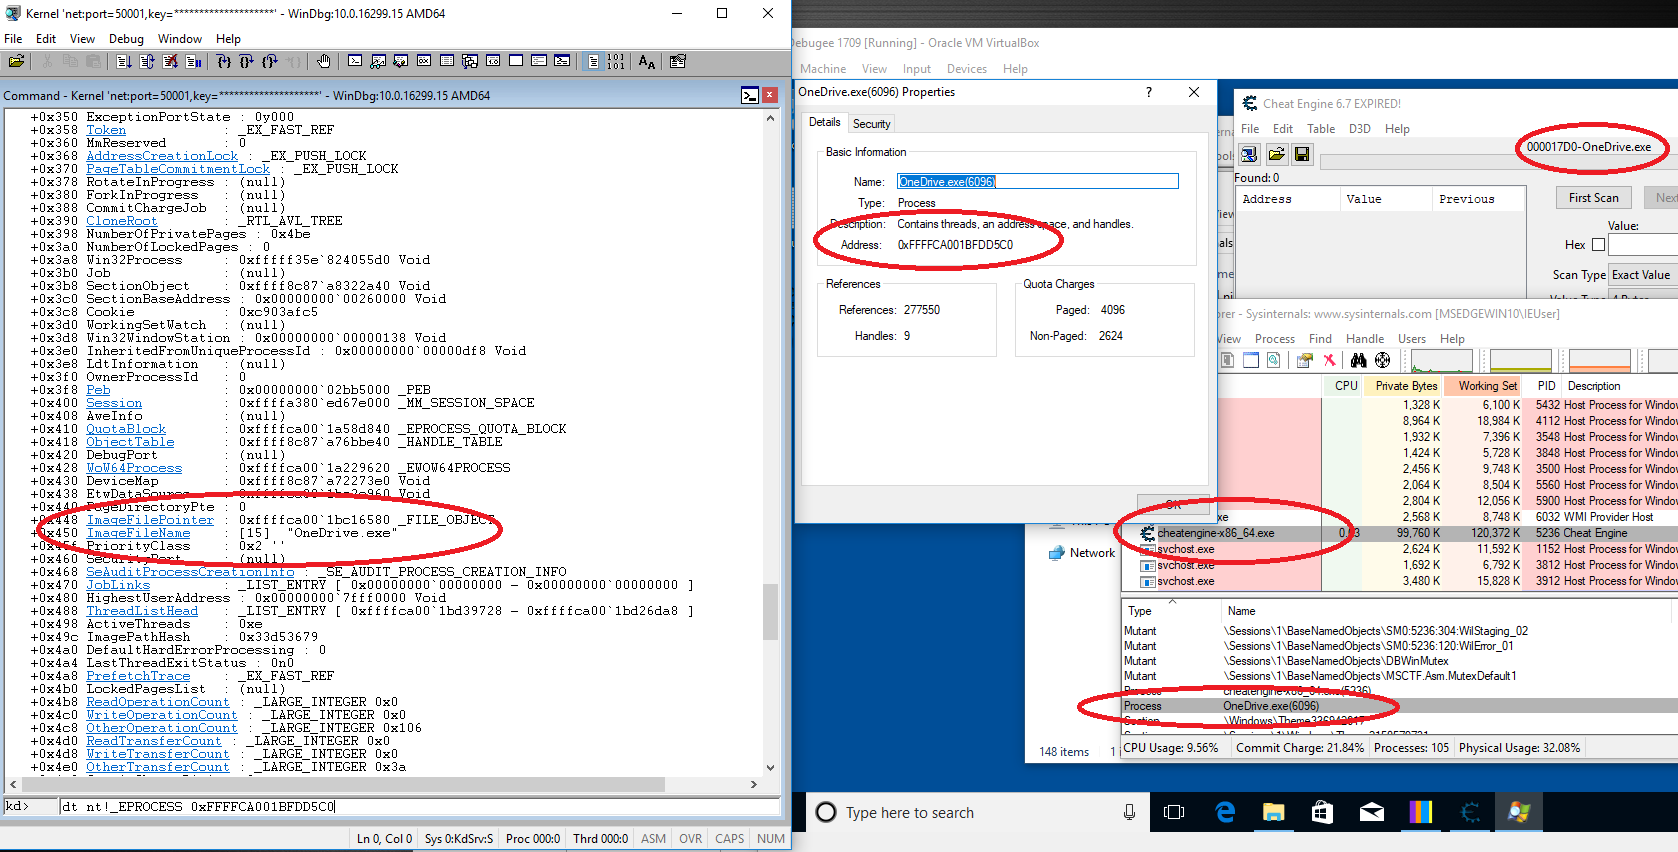
If you open the Task Manager or Process Explorer the process will be gone. And after a few minutes the system may crash with CRITICAL_STRUCTURE_CORRUPTION (109). That’s PatchGuard stumbling upon the changes in kernel memory.
Patchguard?
Kernel Patch Protection (KPP), informally known as PatchGuard, is a feature of 64-bit (x64) editions of Microsoft Windows that prevents patching the kernel.. (Wikipedia)
Depending on when Windbg is attached to the kernel patchguard is disabled. If it is attached early in the boot process patchguard is disabled to prevent the debugging of the patchguard initialization. Conversely Windbg is attached after or late in the boot process patchguard will still be enabled.
For the exercise the crash is the definitely more interesting variation. It hints at the time it may take for patchguard to detect a change (~minutes) and the crash analysis shows a list of what patchguard actually protects. If it didn’t crash for you and you don’t want to restart and edit flinks and blinks all over again you can get a similar output with !analyze -show 0x109.
Exercise 2: Token Borrowing
An access token is an object that describes the security context of a process or thread. The information in a token includes the identity and privileges of the user account associated with the process or thread. {{https://docs.microsoft.com/en-us/windows/desktop/secauthz/access-tokens}}
Tokens are a vital part of the windows security model and they are used in a lot of privilege escalation techniques. A classic example is token stealing: the token of a system process is copied into a user process thereby giving it system privileges.
All you need really are the process objects, so if you want you can try it completely on your own.
Token
	kd> !process 0 0 cmd.exe   -> eprocess address
	kd> dt nt!_EPROCESS <address> Token
	+0x358 Token : _EX_FAST_REF
	#store token address in $t0 for easy reference:
	kd> r $t0 = <address>+0x358
	kd> dt nt!_EX_FAST_REF @$t0
	   +0x000 Object           : 0xffffc00019c16ab5 Void
	   +0x000 RefCnt           : 0y0101
	   +0x000 Value            : 0xffffc00019c16ab5
We found the token. Next we can view it in detail:
	# dereference FAST_REF pointer
	kd> r $t1 = poi($t0)
	kd> !token @$t1
	The address 0xffffe000a035c3d8 does not point to a token object.
	kd> dt nt!_TOKEN  @$t1
	-> will fail or return structure with a lot of 0's and NULL pointers
Something went wrong. Try to find out yourself!
What went wrong?
Short answer: I skipped past the _EX_FAST_REF definition and I shoudn’t have done that.
Long answer:
Upon closer inspection of the EX_FAST_REF structure we can see that it is a union, a structure where all member variable occupy the same space in memory. An even closer look will tell us that the last byte of the Value it used for this reference counter, so the real token address is the pointer value with the last byte set to 0:
r $t1 = poi(@$t0) & -10
	kd> !token @$t1
	...
	User: S-1-5-18
	User Groups:
	 00 S-1-5-32-544
	    Attributes - Default Enabled Owner
	 01 S-1-1-0
	    Attributes - Mandatory Default Enabled
	 02 S-1-5-11
	    Attributes - Mandatory Default Enabled
	...
	Primary Group: S-1-5-18
	Privs:
	 02 0x000000002 SeCreateTokenPrivilege            Attributes -
	 03 0x000000003 SeAssignPrimaryTokenPrivilege     Attributes -
	...
It works. As always it is better to look at the actual object first:
	kd> dt nt!_TOKEN @$t1
	   +0x000 TokenSource      : _TOKEN_SOURCE
	   +0x010 TokenId          : _LUID
	   +0x018 AuthenticationId : _LUID
	   +0x020 ParentTokenId    : _LUID
	   +0x028 ExpirationTime   : _LARGE_INTEGER 0x06207526b64ceb90
	   +0x030 TokenLock        : 0xffffe0009f64f5c0 _ERESOURCE
	   +0x038 ModifiedId       : _LUID
	   +0x040 Privileges       : _SEP_TOKEN_PRIVILEGES
	  ...

	kd> dt nt!_SEP_TOKEN_PRIVILEGES @$t1+0x40
	   +0x000 Present          : 0x0000000ff2ffffbc
	   +0x008 Enabled          : 0x0000000e60b1e890
	   +0x010 EnabledByDefault : 0x0000000e60b1e890
The SEP_TOKEN_PRIVILEGES object is another important security vector. An exploit doesn’t have to copy the whole token. All it may need are a few bits flipped inside the token privileges object to give the privilege needed for a certain escalation. SeDebugPrivilege would be a classic (as in centuries old and probably detected by any antivirus solution on the planet) example as it allows a process to debug another process and thereby to access that process’ memory. There are of course other privileges that can be exploited but that’s really out of scope here.
Borrowing the Token
Now that we know where the token is, that should be a simple exercise:
How to borrow the token?
The solution is not to think too much and just copy the whole EX_FAST_REF
	kd> !process 0 0 cmd.exe
	kd> r $t0 = <process address>+0x358
	kd> !process 0 0 system
	kd> r $t1 = <process address>+0x358
	kd> ep @$t0 poi(@$t1)